USA Today recently ran a front page story reporting new results from the American Religious Identification Survey (ARIS). The story emphasized American religion’s changing landscape, especially the increasing proportion of Americans who say that they have no religion.
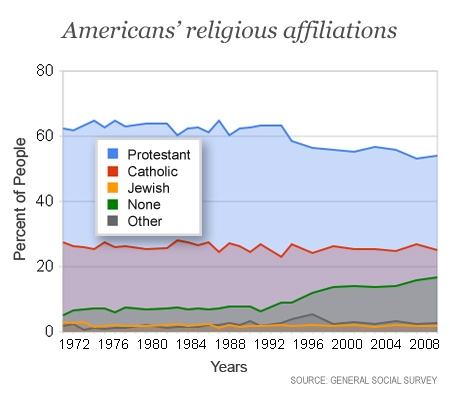
The new ARIS findings are consistent with what we know from other major surveys. One of those other surveys, the General Social Survey (GSS), has been tracking American religious identities since 1972, so it provides a longer view than is provided by ARIS. (See www.norc.org/GSS+Website for details about the GSS.) The graph above tells the basic story of trends in Americans’ self-reported religious affiliations since 1972. It tracks the answers people give when asked: “What is your religious preference? Is it Protestant, Catholic, Jewish, some other religion, or no religion?” (Interestingly, more people now say, “I’m none of these; I’m just Christian,” than used to say this. Such people are included in the Protestant numbers in this graph.)
Let me highlight three features of this figure. First, as emphasized in the ARIS report, the proportion of Americans who claim no religious affiliation has indeed increased. This increase is most noticeable beginning in the 1990s, when it quickened, but it is a long-term trend. In 1957, three percent of Americans said they have no religious affiliation. The percent saying this today is slightly higher in the GSS than in ARIS (17% versus 15%) but that small difference isn’t important. Only a minority of Americans say they have no religion, but that minority has grown steadily over the last several decades, and today between 15 and 20 percent of Americans are religious “nones.”
In a 2002 article published in the American Sociological Review, Michael Hout and Claude Fischer suggest that the post-1990 fast growth in religious “nones” has political roots. The rise of the religious right, they believe, led political moderates and liberals who already were only weakly committed to their religious identities to take the step of saying outright (perhaps to themselves as well as to survey researchers) that they had no religion at all.
A second feature of the religious identity trends I want to highlight is the increasing percentage of Muslims, Buddhists, Hindus, and others who are neither Christian nor Jewish. From one perspective this increase is dramatic, with the number of people claiming a religion other than Christian or Jewish more than doubling from about 1 percent in the 1970s to between 2.5 and 3 percent today. This increase is not obvious on the graph because the total percentage of religious “others” remains very small. This may seem surprising, but recall that a majority of recent immigrants to the United States come from predominantly Christian countries, and two-thirds of recent legal immigrants are Christian. The proportion of self-identified Jews in the United States has remained at about 2% since 1975, and there are about as many Jews in the U.S. as there are Muslims, Buddhists, and Hindus combined. So the percentage of non-Judeo-Christians in the United States remains small, but that percentage has grown and continues to grow.
Third, the increases in those with no religion and those whose religion is something other than Christian or Jewish have come mainly at the expense of Protestants. The declining proportion of Protestants in the United States is a very long-term trend, and it continues since 1972. In the early 1970s, approximately 62% of Americans identified with a Protestant church or denomination; by 2006, just over half do. If this continues, as it surely will, the United States soon will not have a Protestant majority for the first time in its history.
The upshot of these trends is that religious diversity increased in the United States over this period. And it’s not just that our cities and neighborhoods are more religiously diverse than they used to be. Even our families and friendship circles are more religiously diverse. Only about 10% of married people born before 1920 married across one of the five broad religious categories tracked in this graph; about 25% of those born after 1950, and about 30% of those born after 1980, have married across those lines. And, in 2004, 40% of people named someone in a different broad religious group when asked to name five “people with whom you discussed matters important to you,” up from 34% in 1985. Religious diversity has increased in many people’s everyday lives as well as in society as a whole.
It’s not just that religious diversity has increased. The percentage of Americans who say they would vote for an otherwise qualified Catholic, Jew, or atheist who was running for President has increased dramatically since the middle of the twentieth century, to the point where today almost all say they would vote for a Catholic or Jew and about half say they would vote for an atheist. As I described in an earlier post, three quarters of Americans now say “yes” when asked if they believe there is any religion other than one’s own that offers a true path to God, and 70 percent of those who are religiously affiliated agree that many religions can lead to eternal life. And remember those increasing rates of religious intermarriage. Not only is the United States more religiously diverse than it was several decades ago; Americans appreciate that diversity more than they used to.